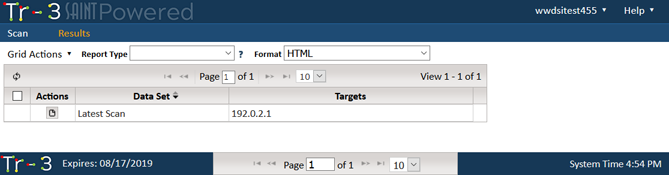
Select the Results Tab to view scan results for completed scans. The following shows an example of a completed scan for the one previously scheduled.
Tr-3 uses the same reporting engine as used in other SAINT products. As shown in the following example, it includes nine (9) pre-configured report types designed to quickly provide reports that will be the most useful for specific purposes.
The steps to generate a pre-configured report follow:
Select the Report Type that best suits your needs.
For Trend Analysis reports
only – Choose the number of data sets you wish to include in the trend
analysis. Hosts and vulnerabilities will be tracked chronologically
across the chosen number of data sets, producing history charts and
status classifications.
Select the Report Format from the drop-down list of available
formats.
HTML is usually
the best choice for quick screen analysis. This report format
uses Portable Network Graphic (PNG) images to graphically display
pie charts and bar graphs. It also uses HTML frames to provide
a linked table of contents for report navigation.
Frameless HTML is
like the HTML format except that it does not provide a linked
table of contents.
Simple HTML displays
pie charts and bar graphs in-line, not as PNG images. However,
the pie charts are only viewable on Internet Explorer.
PDF is the most
often used and most convenient format to download and share with
others.
XML is useful if
the Tr-3 data is to be processed by XML-enabled applications.
Text is a useful
alternative if you intend to view the report on a machine without
a web browser.
CSV is the most
often used format for simple text-based content usage, viewing
in Microsoft Excel and working with the raw scan results.
Tab-separated and comma-separated
reports are useful for importing into documents, spreadsheets,
or databases. These formats are useful with the Technical Overview
report.
Click on the Create Report
button on the selected scan to create and view the report.
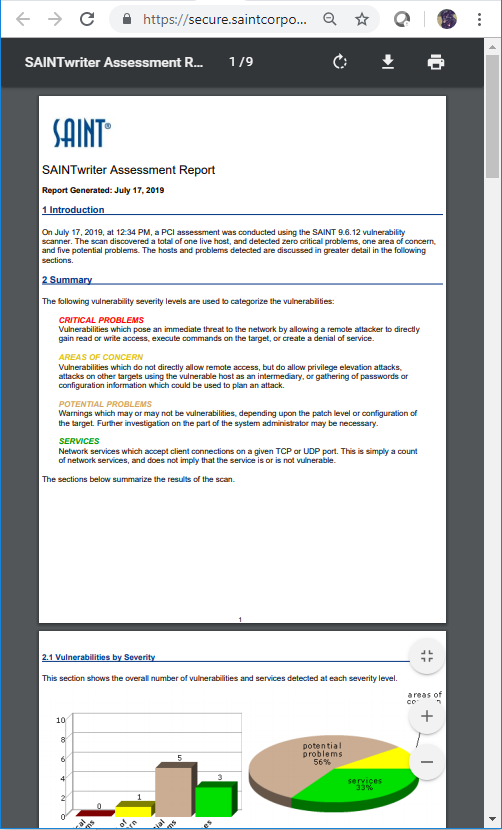
The report will be generated and displayed in its own browser tab.
You can view, print and save scan output from the displayed
report. In most browsers, this is done by choosing Save
As under the File menu.
Adobe Acrobat also supports these actions from within the browser window,
as shown in the following example: